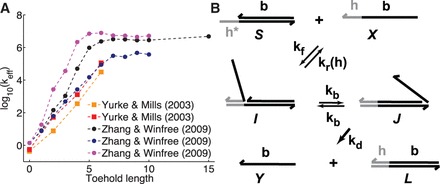
Figure 2.

(A) Dependence of  on toehold length, measured by Yurke and Mills (31) (at 20°C, 1 M Na+) and Zhang and Winfree (30) (at 25°C, 12.5 mM Mg++). Each curve is from a different toehold sequence. (B) The phenomenological model of Zhang and Winfree (30). kd is assumed to be large relative to other rate constants.
