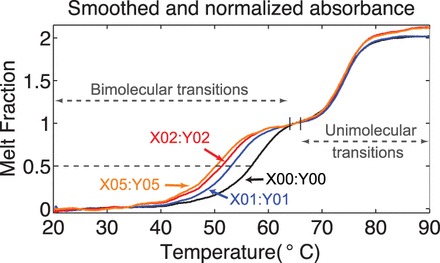
Figure 7.

Smoothed and normalized UV absorbance data while annealing (at 200 nM). The lower temperature transition is the (bimolecular) formation of the complex, whereas the higher temperature transition is the (unimolecular) formation of the hairpin. The mean absorbance between  and 35°C is normalized to 0 and that between
  and 66°C (indicated by vertical lines) to 1. The temperature range whose mean absorbance is normalized to 1 is concentration-dependent (Supplementary Table S3). Data acquired by annealing and melting are essentially superimposable. The dashed line indicates the halfway point of the bimolecular transition.
