Figure 5.

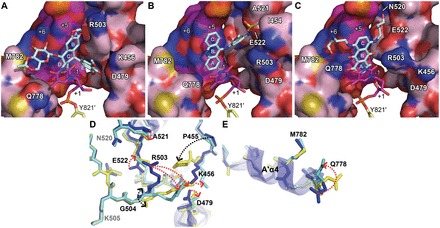
Conformational landscapes of the drug-binding pockets for mammalian Top2-targeting anticancer drugs. (A–C) Surface/stick representations of the etoposide-, m-AMSA- and mitoxantrone-binding sites, respectively. Selected DNA base pairs (purple) and protein (pink) residues are shown as surface representations and are labeled using white letters. Two hTop2βcore monomers are colored differently. Drugs (cyan) and the Y821′-conjugated +1 thymidines are shown as sticks. Labels belonging to the second monomer are flagged by a prime. Cyan letters designate polycyclic ring labeling of drugs. (D and E) Superposition of residues 445–731 and residues 762–821 in hTop2β of the drug-stabilized hTop2cc structures to show structural differences in the minor groove and major groove drug-binding pockets, respectively. Selected residues of hTop2cc structures stabilized by etoposide (blue), m-AMSA (yellow) and mitoxantrone (cyan) are shown as sticks. Side chain and main chain variations are indicated by red and black arrows, respectively. Residues that exhibit no structural change under drug binding are labeled in gray.
