
Figure 1.
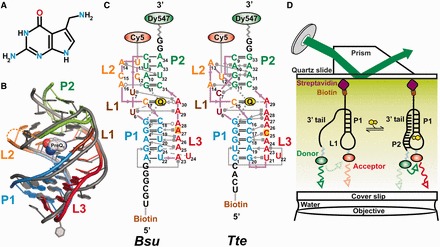
Structural comparison of the Bsu and Tte preQ1 riboswitches. (A) Structure of preQ1 (7-aminomethyl-7-deazaguanine). (B) Structural overlay of the Bsu (colored, PDB ID 3FU2, chain A) and Tte (gray, PDB ID 3Q50) riboswitch crystal structures. The sugar-phosphate backbone is shown as a single ribbon. preQ1 is space-filled and colored as in A. Secondary structure elements are color-coded as indicated. (C) Secondary structure maps of the Bsu and Tte riboswitches with interactions shown in Leontis–Westhof nomenclature (14). Individual secondary structures are color-coded as in (B), and the locations of fluorophores and biotin are indicated. (D) Prism-based TIRFM setup for smFRET.