
Figure 3.
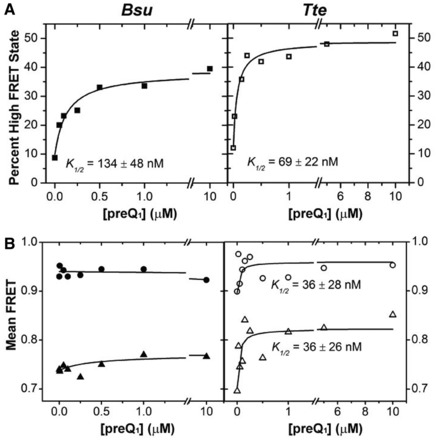
Effect of ligand on the distribution of the mid- and high-FRET states. (A) The FRET histograms of Figure 2 were quantified, and the percentage high-FRET state was plotted as a function of ligand concentration. The data were fit with a non-cooperative binding isotherm and the respective apparent K1/2 values are indicated for both Bsu (closed symbols) and Tte (open symbols). (B) The centers of the Gaussian fits for the mid-FRET (green) and high-FRET (blue) states from Figure 2 were plotted as a function of ligand concentration and fit with a non-cooperative binding isotherm, yielding the K1/2 values indicated for the Tte riboswitch.