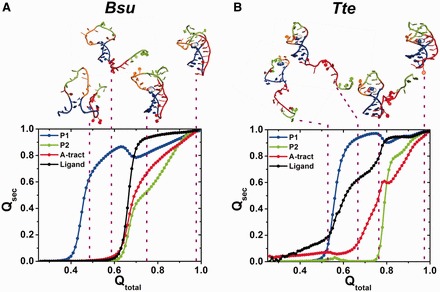
Figure 5.

Gō model simulations of single Bsu (A) and Tte (B) riboswitch molecules. Fraction of native contacts for each structural component, Qsec (P1, blue; P2, green; A-tract, red; ligand, black), averaged over each 51 simulations and plotted as a function of the fraction of total contacts observed in the native folded structure, Qtotal. Above, characteristic points along the folding pathway are illustrated with each one representative conformation.
