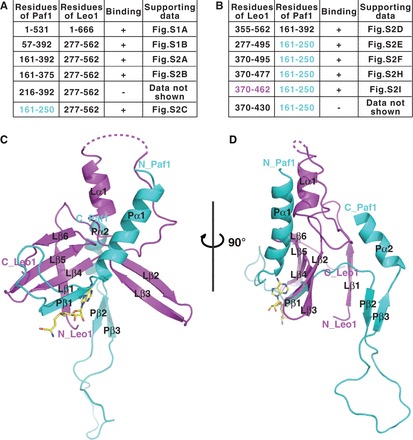
Figure 1.

Crystal structure of the human Paf1/Leo1 subcomplex. (A and B) Gel filtration-based test of the binding of Paf1 and Leo1 by the co-expression of target proteins. ‘+’ indicates protein binding, according to the supporting data in Supplementary Figures S1 and S2; ‘−’ indicates no protein binding. The protein fragments of the complex used for structural determination were Paf1(161–250) colored in cyan, and Leo1(370–462) colored in magenta. (C) A cartoon representation of the structure of the Paf1(161–250)-Leo1(370–462) heterodimer complex. Paf1 is shown in cyan, and Leo1 is shown in magenta. The bound AdoMet is shown as a stick model and colored in yellow. (D) A side view of the Paf1(161–250)-Leo1(370–462) heterodimer complex. The N- and C-termini of the two proteins are labeled. For clarity, the β-strand formed by the artificial linker is not shown.
