Figure 5.

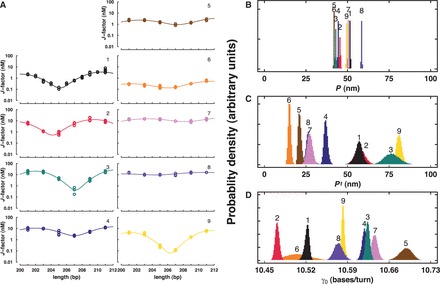
Summary of WLC analysis. J-factor curves for natural and DNA-like polymers (A) and parameter distributions for P (B), Pt (related to by C = kTPt) (C) and γ0 (D).

Summary of WLC analysis. J-factor curves for natural and DNA-like polymers (A) and parameter distributions for P (B), Pt (related to by C = kTPt) (C) and γ0 (D).