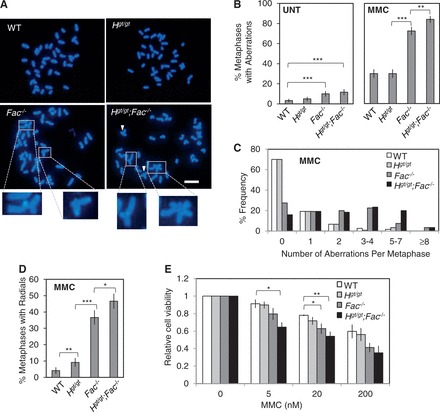
Figure 4.

Helqgt/gt cells display modest sensitivity to MMC. (A) Shown are representative images of DAPI-stained metaphase spreads from all genotypes following MMC treatment (600 nM MMC for 2 h followed by 22 h recovery before harvest). White arrowheads indicate chromosome aberrations. Enlarged images of radial structures from the Fancc−/− and Helqgt/gt;Fancc−/− samples are shown at bottom. Scale bar is 10 µm. (B) Shown are the average percentages of metaphases positive for chromosomal aberrations in the untreated (left) or MMC-treated (right) conditions. For each experimental group, 120 metaphases were scored. (C) A histogram displaying the number of aberrations per metaphase for each genotype after MMC treatment is shown. (D) The average percentages of metaphases positive for radial structures after MMC treatment are shown. (E) The MTT assay reveals that Helqgt/gt cells display little, if any MMC sensitivity compared with Fancc−/− or Helqgt/gt;Fancc−/− cells. Cells were treated with the indicated doses of MMC for 5 days before analysis. Error bars show either the binomial error of the combined data set (B, D) or the SEMs for at least three independent experiments (E). Significance was determined by either χ2-test (B, D) or t-test (E). Statistical significance at P < 0.05, P < 0.01 and P < 0.001 is indicated as *, ** and ***, respectively. WT, Hgt/gt, Fac−/− and Hgt/gt;Fac−/− refer to WT, Helqgt/gt, Fancc−/− and Helqgt/gt;Fancc−/− respectively.
