
Figure 2.
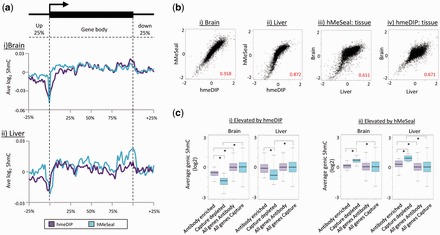
Genic patterns of 5hmC enrichment are similar following enrichment by hmeDIP or hMeSeal. (a) Average pattern of 5hmC across promoter and genic regions are highly similar following independent purification by either hmeDIP (purple) or hMeSeal (blue) in both the brain (i) and liver (ii). Average 5hmC values were calculated at positions relative to the full length of the gene with analysis extending 25% up and downstream. Y-axis plots average log2 scores taken from microarray datasets. (b) Scatter plots of average length adjusted genic levels of 5hmC between hmeDIP and hMeSeal in the brain (i) and liver (ii) tissues (each n = 2). Scatterplots are also shown to compare the relationships between the genic 5hmC levels across tissues by both hMeSeal (iii) and hmeDIP (iv). Pearson correlation values are shown in red in each plot. Data are plotted for average log2 scores from −2 to +2 for the 5hmC content of each gene following length adjustment. (c) Box plots of average length normalized 5hmC levels across genes exhibiting a strong relative enrichment following either antibody (i) or chemical capture (ii) purification compared to all genes on the array. Antibody purified; purple, chemical capture purified; blue. Genes enriched by hmeDIP versus hMeSeal are typically depleted in 5hmC with respect to all genes indicating higher levels of noise. Conversely, regions enriched by hMeSeal are genuinely enriched over the bulk of the genes on the array.*Denotes Willcox P-value scores <0.05.