
Figure 5.
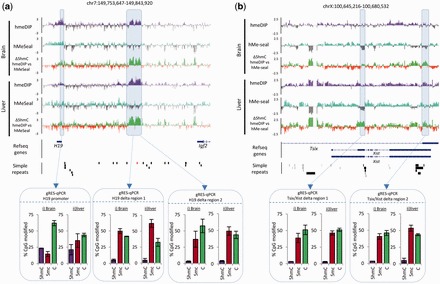
Imprinted loci at the H19/Igf2r (a) and Tsix/Xist (b) genes contain strong regions of technique dependant enrichment bias. Microarray data is plotted as describe earlier for Figure 3d. Enrichment by hmeDIP = purple track, hMeSeal= blue track, regions of depletion = grey in both tracks, hmeDIP bias = green track, hMeSeal bias = red track. Genes are displayed below as blue bars and simple repeats as black bars. The simple repeat highlighted in red refers to a region of TC tandem repeats. Boxed areas represent regions validated independently by gRES-qPCR (see description in Figure 4d).