Figure 1.

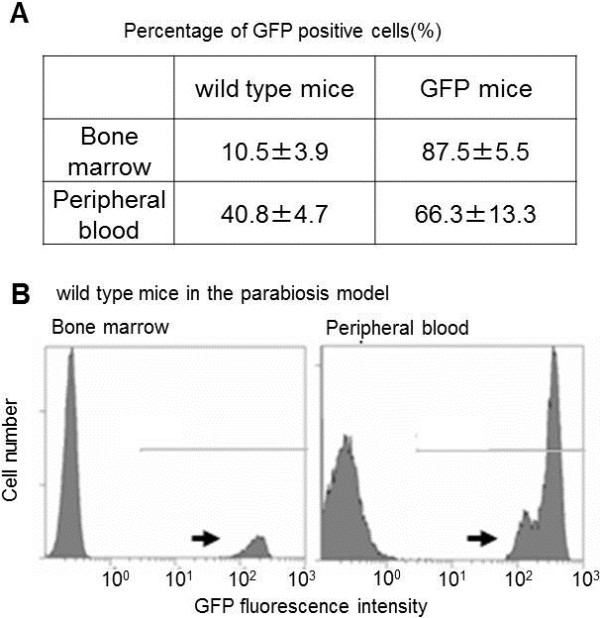
Proportion of cells expressing GFP in the bone marrow and in the peripheral blood in the parabiosis model. To evaluate the successes of the parabiosis model, the percentage of the cells expressing GFP was analyzed in the bone marrow and in the peripheral blood by flow cytometry 6 weeks after parabiosis. Values are mean +/− SD of three animals (A). Representative cases of flow cytometry in the parabiosis model are shown (B). Arrows indicate cell population expressing GFP.
