
Figure 5.
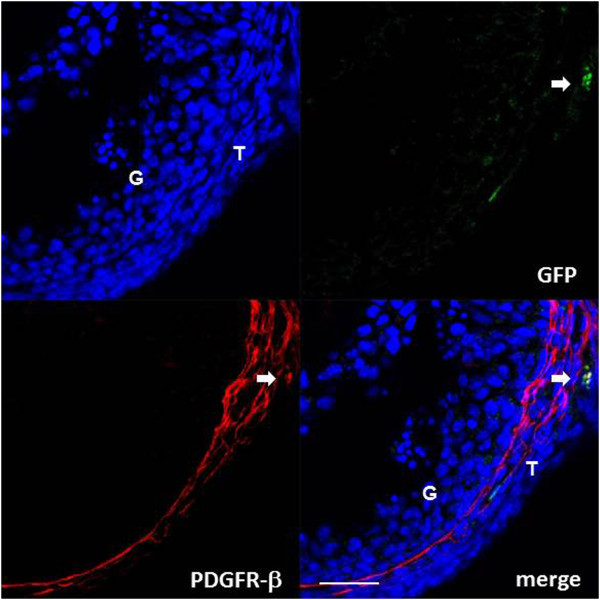
Fluorescence-based immunodetection of PDGFR-β (a pericyte marker) in the parabiosis model. PDGFR-β is shown as red. GFP is shown as autofluorescence green. Arrows indicate PDGFR-β and GFP double-positive cells. Immunostaining was evaluated on three to four tissue sections in each ovary in each developmental stage of the follicles. The developmental stages are defined in Materials and Methods. T: theca cell layer, G: granulosa cell layer. Scale bars; 20 μm.