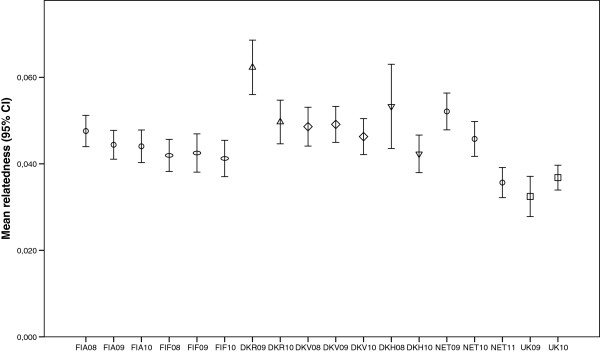
Figure 2.

Mean relatedness of individuals in the temporal samples. Relatedness estimates (with 95% confidence intervals) were calculated in ML-Relate taking potential null alleles into account. Population codes and sampling years are described in Table 1. Symbols are used to separate populations (same symbols are used for temporal samples within a population).
