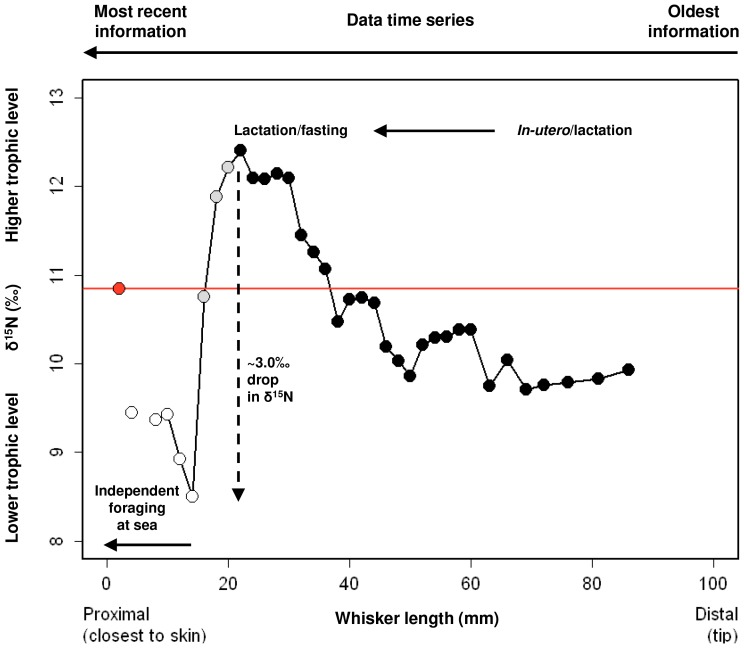
Figure 1. A schematic plot used to determine the shift to independent foraging along the post-trip whisker.
We used stable nitrogen isotope values incorporated along the temporal span of the whisker as represented by the growth of the whisker from the distal (tip; oldest isotopic information) to proximal region (closest to the skin; most recent isotopic information). The red line indicates where the pre-trip basal segment (red symbol) intercepts δ15N values along the length of whisker. Solid arrows indicate the shift in food source along the temporal span from in utero/lactation to lactation/fasting (black symbols) to independent foraging at sea (open symbols). Dashed arrow indicates 3.9‰ drop in δ15N (equivalent to one trophic level ∼3.0‰; grey symbols). The first 14 mm of whisker represents independent foraging at sea.

