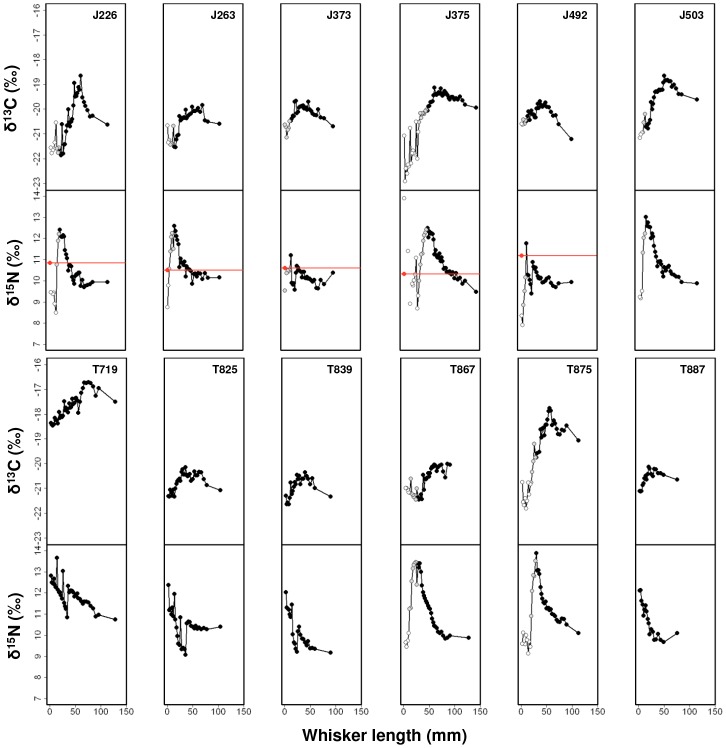
Figure 2. Schematic plots of δ13C and δ15N values along the post-trip whiskers of 12 sub-yearling southern elephant seals.
We used stable carbon and nitrogen isotope values incorporated along the length of the whisker (mm). Values are colour-coded according to shift in food source along the temporal span of whisker presented in Fig. 1. Black symbols: in-utero/lactation/fasting; grey symbols: diet shift from mother’s milk and/or fasting to other food sources; open symbols: independent foraging at sea.

