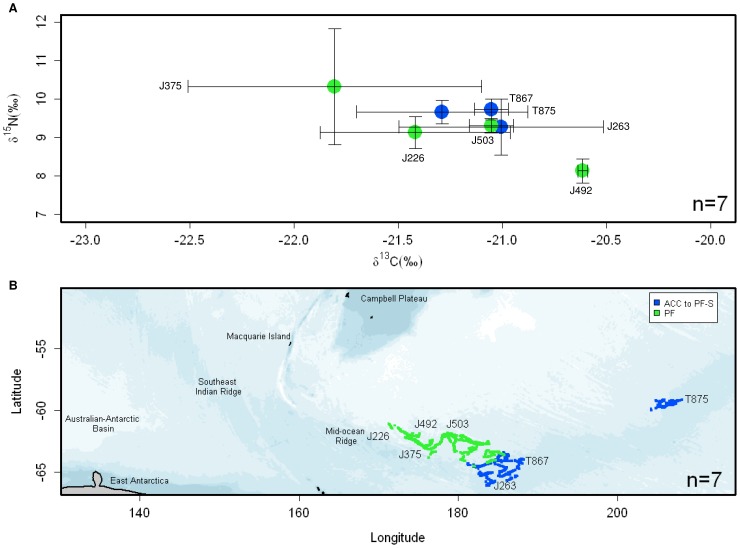
Figure 4. Area Restricted Search locations and whisker δ13C and δ15N values reflecting independent foraging at sea.
(A) Mean δ13C and δ15N whisker values and (B) Area Restricted Search locations for 7 sub-yearling elephant seals during their first migration from Macquarie Island are colour-coded according to foraging location (Inter-Frontal Zones, IFZs, presented in Fig. 2). Bathymetric features including the Southeast Indian Ridge, Australian-Antarctic Basin and Mid-Ocean Ridge are indicated in (B). Values are mean±SD.

