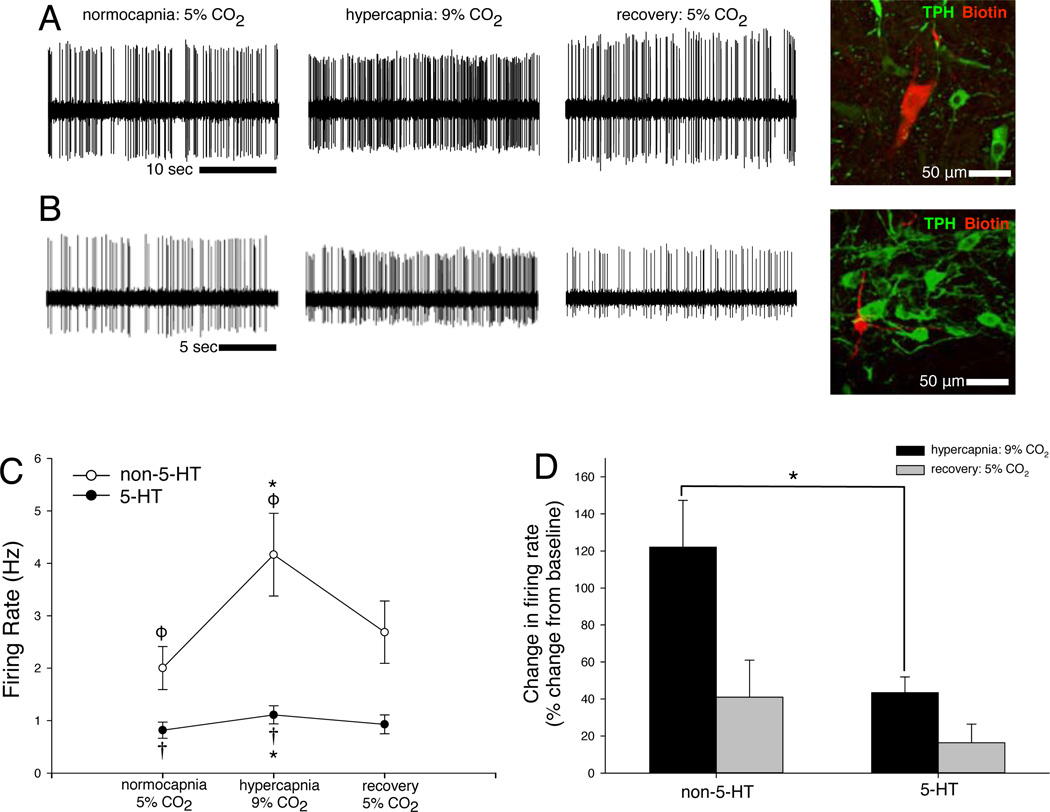
Figure 3. Definitively phenotyped CO2-stimulated 5-HT and non-5-HT cells are distinct, and non-5-HT cells are more robustly stimulated by CO2 than are 5-HT cells.
A neuron (row A) had normocapnic and hypercapnic firing rates of 4.26 Hz and 8.45 Hz, respectively (a 98% increase with hypercapnia), and was subsequently filled and stained negative for TPH-ir. Another neuron (row B) had firing rates of 0.45 Hz and 1.21 Hz (a 123% increase), and was also negative for TPH-ir. Both cells were within the raphé and closely apposed to several TPH-ir 5-HT cells. (D) In definitively phenotyped CO2-stimulated cells, hypercapnia caused a mean 44% increase in firing rate of 5-HT cells (filled circles, †), and a mean 125% increase in firing rate of non-5-HT cells (open circles, ϕ). Normocapnic recovery returned firing frequencies to baseline levels. Firing frequencies differed between CO2-stimulated putative 5-HT and non-5-HT neuron groups during hypercapnia (∗). (E) Hypercapnic firing frequencies normalized to respective baseline firing frequencies confirm differences in hypercapnic responses between the CO2-stimulated 5-HT and non-5-HT neuron groups (∗). Symbols denote p < 0.05 between means (e.g. means labeled “*” differ from each other, means labeled “†” differ from each other, etc.).

