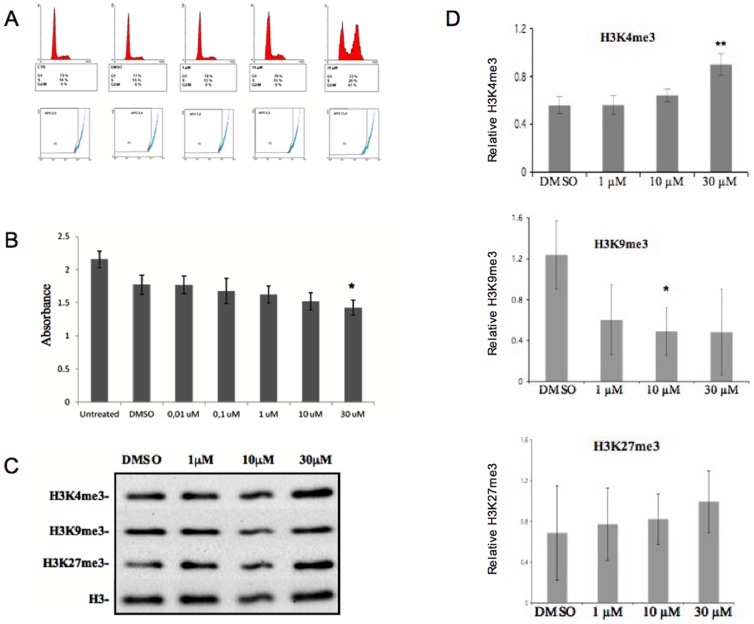
Figure 7. In vivo effects of the 3195 compound on HeLa cells.
(A) Flow-cytometry analysis of HeLa cell of DNA content after 24 h incubation with different concentrations of 3195. Flow-cytometry analysis was carried out as described in the experimental procedure section. Fluorescence and inferred cell cycle distribution (top panel) and putative percent of apoptotic cells (bottom panel) are reported. (B) Cytotoxicity assay: the histogram reports the absorbance measured at 450 nm which is proportional to the number of alive cells and represent the average of four independent experiments. Standard deviation is reported. Asterisk indicates significant difference between inhibitor treated cells and DMSO control cells, according to Student's t test results (* = P<0.02).(C) Western blot analysis shows H3K4me3, H3K9me3, H3K27me3 levels and total H3 level in the HeLa cell acid protein fractions after 24 h of treatment with the indicated concentrations of compound 3195 or with DMSO. (D) Quantitation of data obtained as in panel C. Data refer to 3 (H3K9me3 and H3K27me3) or 4 (H3K4me3) independent experiments. Standard deviation is reported. Asterisks indicate where the change in tri-methylation induced by the compound 3195 is significant, according to Student t-test results (* = P<0.05; ** = P<0.01).

