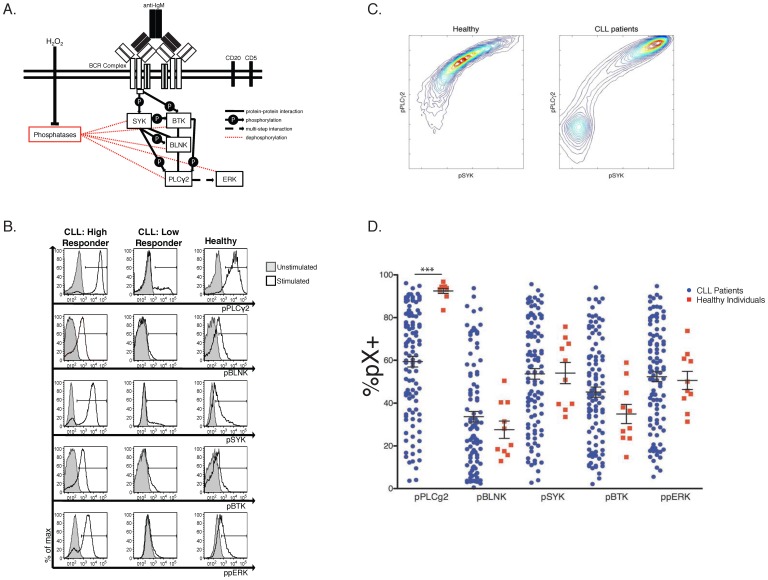
Figure 1. Phosphoprofiling of the Proximal BCR Signaling Pathway Uncovers High Variability in BCR Signaling Pathway Behavior in CLL B cells.
A. Simplified diagram of the BCR signaling pathway components investigated in this study. B. Representative histograms of phosphoresponses of B- cells for two CLL patients (a high and a low responder) and one healthy individual. CLL and healthy B cells were gated as described in the methods section. Stimulated samples (anti-IgM+H2O2) are indicated by a black line, unstimulated samples are shaded grey. C. Contour maps of the average B cell population: For each cohort, CLL and healthy, the cellular phosphoresponse fluorescence intensity values are averaged and viewed two dimensionally. Bimodality in the phosphoresponse of CLL B cells can be seen for the pairwise pPLCγ2 vs. pSYK) (see also Supp. Fig. S2 for other combinations of phosphoresponses). Healthy B cells show modest variability within the B-cell population, while the CLL B cells can be distinguished by their all-or-none response. D. Following IgM crosslinking, phosphoresponses are shown as the percentage of responding cells for each patient over an unstimulated matched control. This view of the wide, continuous range of each CLL patients' phosphoprofile highlights the high variability in the behavior of the BCR signaling pathway. Only the pPLCγ2 response showed statistical significance when comparing healthy to CLL cells (***p<0.0001).

