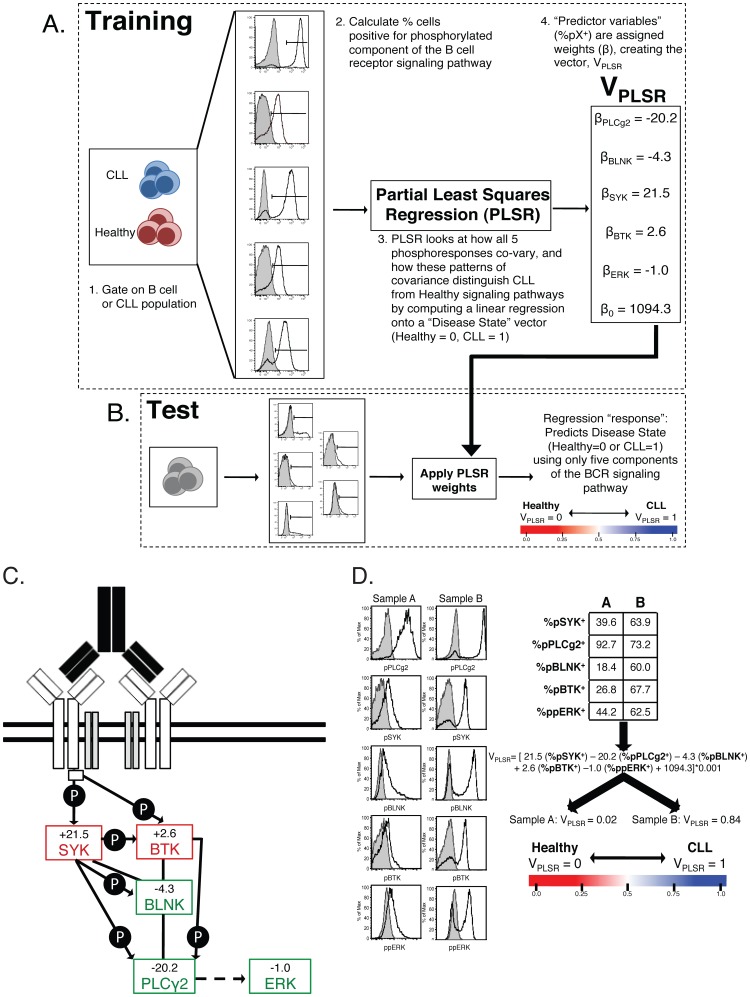
Figure 3. Statistical Analysis of CLL B-cell Phosphoprofile using Partial Least Squares Regression (PLSR) against disease status.
This figure details our method for analyzing phosphoflow data by Partial Least Squares Regression (PLSR) against disease status: A Training: 1 CLL B cells or healthy B cells were isolated using the gating described in the methods section. 2 Phosphospecific antibodies allowed detection of the phosphoresponse for pPLCγ2, pSYK, pBTK, pBLNK and ppERK. The percentage of cells positive for each phosphospecific antibody was calculated based on the unstimulated histograms. These %pX+ provide the raw data for Partial Least Squares Regression analysis, PLSR. 3 PLSR was applied to best correlate a linear combination of these phosphoprofiles for each patient (all healthy controls and all CLL samples pooled together) with a variable defining disease status (arbitrarily set to 0 for healthy individuals and 1 for CLL patients). This step of the analysis is referred to as “Training” as the PLSR algorithm uses a subset of CLL B cells and Healthy B cells to model the covariance of each phosphoresponse. 4 The output of PLSR analysis is a linear combination VPLSR with weights (βi) to each observed “predictor” variable (%pXi +). The PLSR algorithm output attempts to find weights that best match the differences between healthy and CLL patient phosphoprofiles with disease status. B Test: Using the model (VPLSR) defined during the training phase, we tested the power of our model by its ability to correctly predict the disease status of independently-acquired CLL patients and healthy individuals. Phosphoresponses are measured and linearly-combined into a VPLSR variable as specified by the training step. C BCR signaling diagram highlighting pathway-based understanding of the VPLSR score and weights. D Example of VPLSR predictive power: two samples (one CLL and one healthy control) were tested side-by-side. As predicted, VPLSR helps discriminate their differences in phosphoresponses. As illustrated in Fig. 3A, %pX+ values over an unstimulated control are calculated and linearly combined to yield VPLSR for the sample under consideration. Sample 1119, yields VPLSR = 0.02, while Sample 1062, yields VPLSR = 0.84, consistently with disease status (healthy and CLL, respectively).

