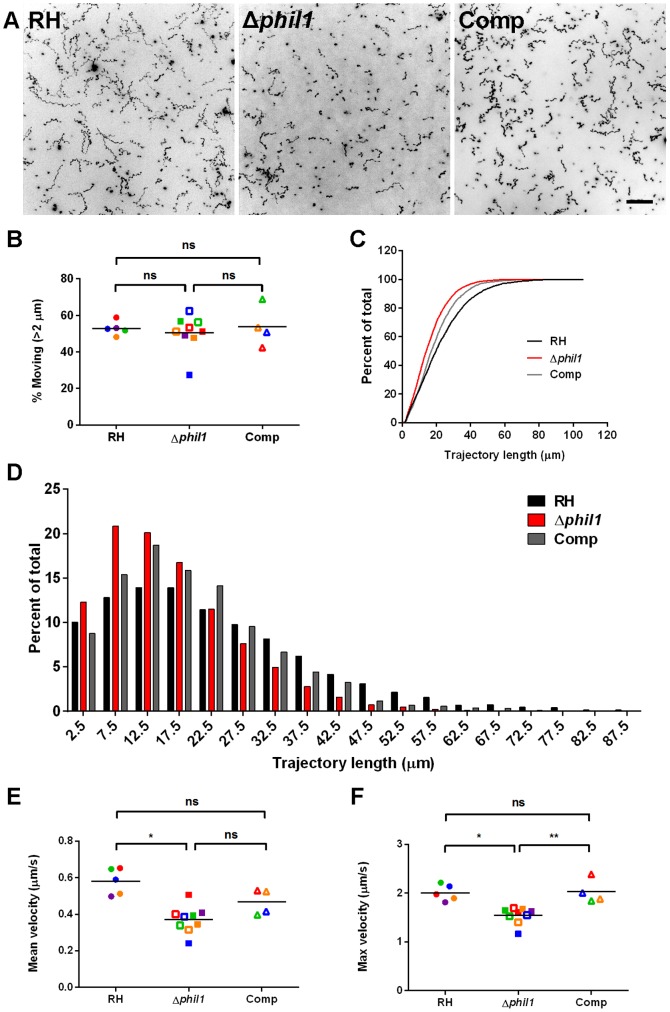
Figure 3. 3D motility of the Δphil1 parasites.
(A) MIPs for wild-type (RH), TgPHIL1 knockout (Δphil1) and complemented (Comp) parasites. Scale bar = 50 µm. The colour scheme for all MIPs was inverted for better visualization of parasite trajectories. The percentage of total parasites moving (B) was comparable for the three parasite lines, but the cumulative frequency distribution (C) and histogram (D) of the smoothed trajectory lengths for RH (black), Δphil1 (red) and Comp parasites (grey) reveal that the Δphil1 parasites do not move as far as the RH or Comp parasites within the same timeframe (Kolmogorov-Smirnov test, D = 0.199, p<0.0001 and D = 0.114, p<0.0001, respectively). The Δphil1 parasites also exhibited significantly decreased mean velocity compared to the RH parasites (E) and significantly reduced maximum velocity compared to both RH and Comp parasites (F) (paired t-test, significance indicated by asterisks). Closed data points are the results from five independent experiments comparing RH and Δphil1 parasites; open data points are the results from four independent experiments comparing Δphil1 and Comp parasites. Each of the independent experiments (assigned a different colour in the scatter plot) was performed in either triplicate or quadruplicate. The total number of parasites analyzed was 6,467 for RH, 9,305 for Δphil1 and 3,743 for Comp. * p<0.05, ** p<0.001, ns = not significant.

