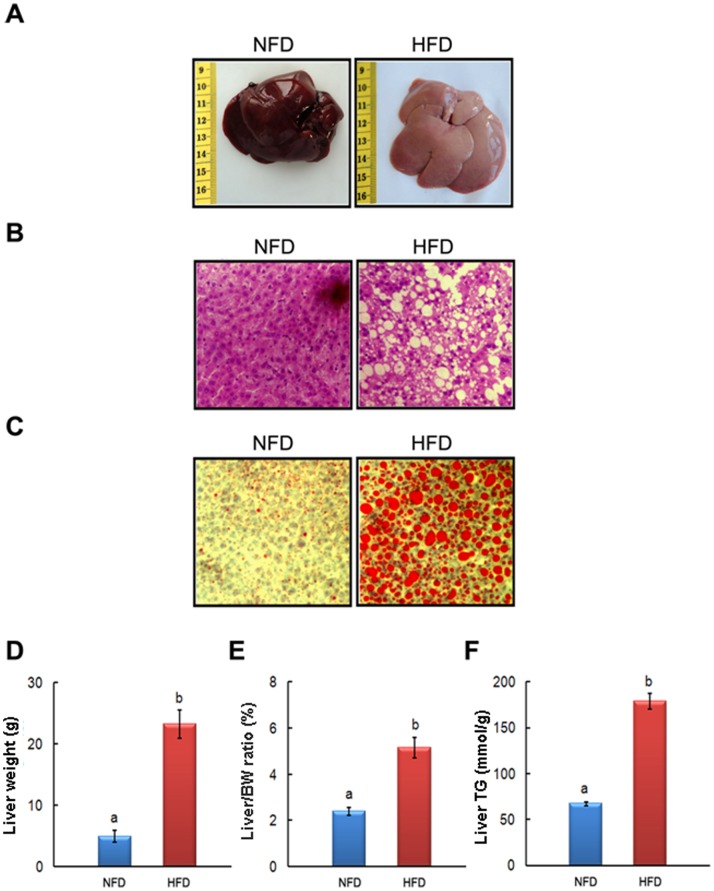
Figure 1. HFD-induced obese NAFLD rat model.
The representative photographs and biochemical index were presented as follow: (A) liver morphological photographs, (B) H&E staining photomicrographs of the liver section (100×), (C) Oil Red O staining photomicrographs of the liver section (100×), (D) Liver weight, (E) relative weight of the liver, and (F) Liver triglyceride. Values are means ± SEM (NFD, n = 13; HFD, n = 70). The values with different superscripts are significantly different at P<0.05.

