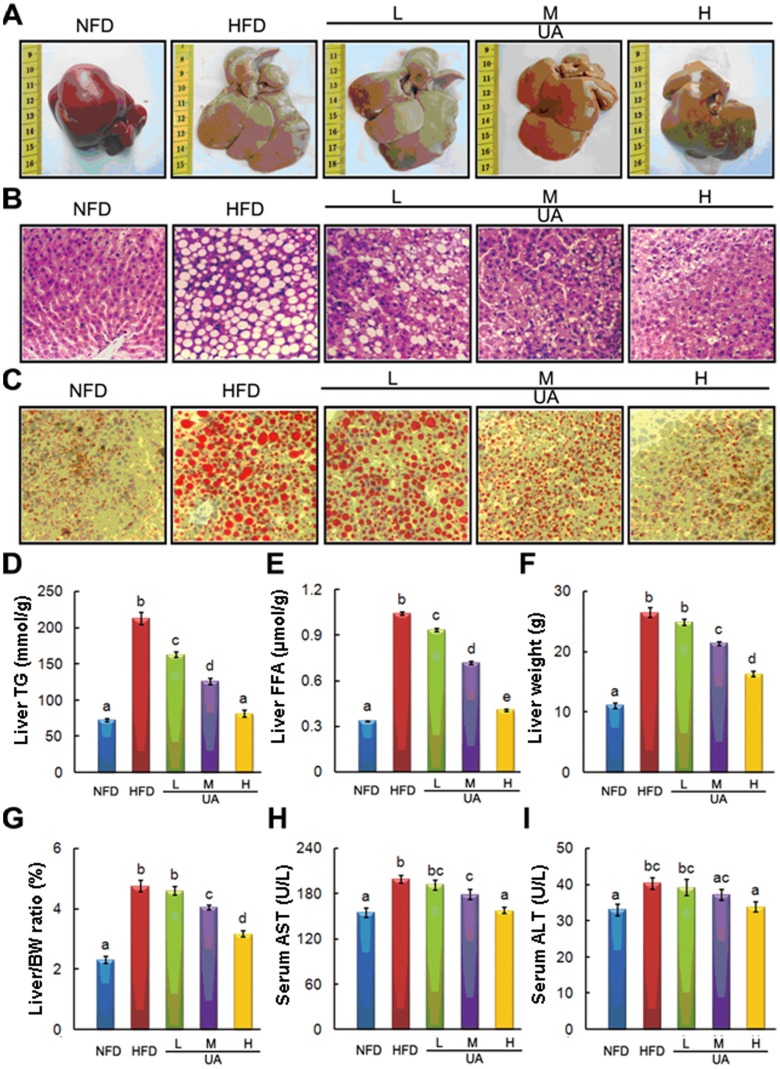
Figure 2. Effects of UA on the liver histology, hepatic lipids, and serum ALT and AST.
The representative photographs and biochemical index were presented as follow: (A) Morphological photographs, (B) H&E staining photomicrographs of the liver section (100×), (C) Oil Red O staining photomicrographs of the liver section (100×), (D) Liver triglyceride, (E) Liver FFA, (F) Liver weight, (G) The ratio between liver and body weight, (H) Serum AST, and (I) Serum ALT. The values with different superscripts are significantly different at P<0.05. All the groups contain 10 animals (n = 10).

