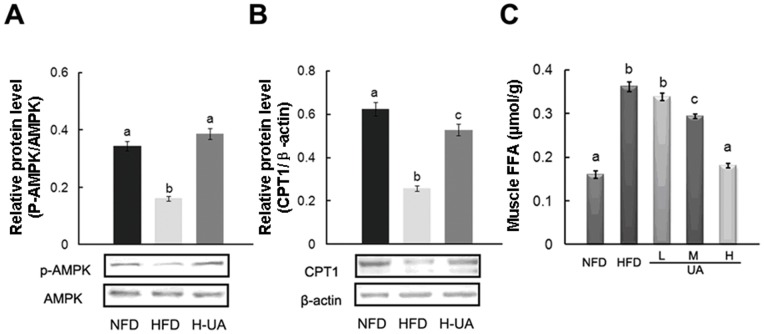
Figure 5. Effects of UA treatment on the muscle and the possible molecular mechanisms.
Muscle relative protein content of (A) p-AMPK and (B) CPT-1. (C) Muscle FFA. The values with different superscripts are significantly different at P<0.05. All the groups contain 10 animals (n = 10), and a representative blot is shown.

