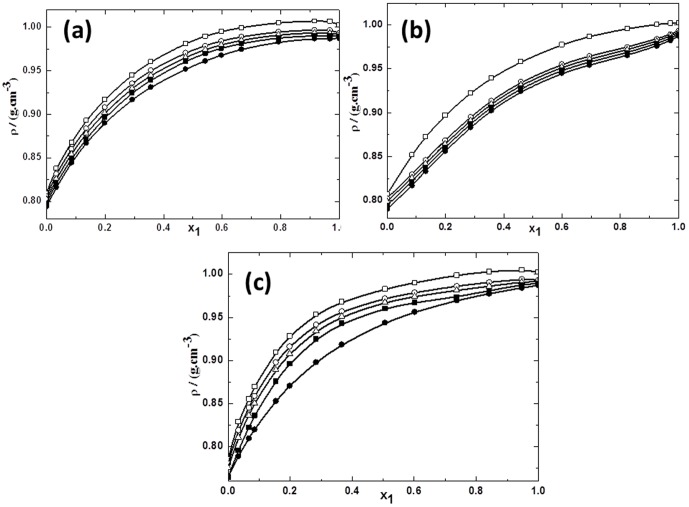
Figure 2. Densities for the mixtures of TBAH with alcohols vs mole fraction of IL x1 for (a) TBAH+1-butanol; (b) TBAH+2-butanol and (c) TBAH+2-methyl-2-propanol, 293.15 K (□), 298.15 K (○), 303.15 K (▵), 308.15 K (▪),313.15 K (•) at various compositions and at atmospheric pressure.
The solid line represents the smoothness of these data.

