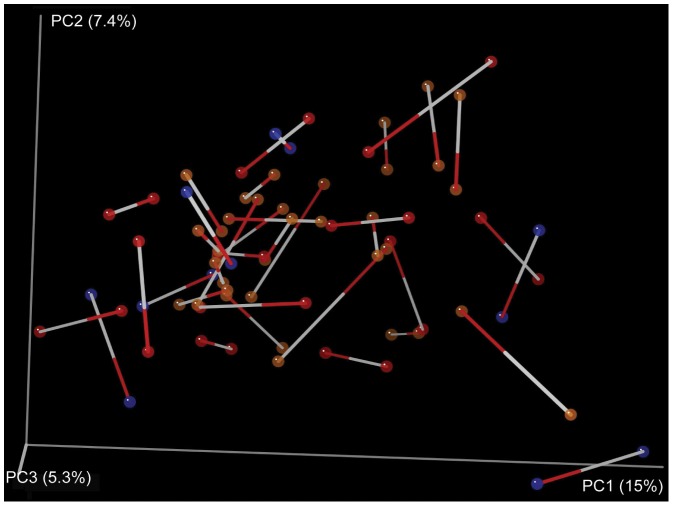
Figure 1. Procrustes analysis of samples before and after periodontal treatment, Procrustes M2 value = 0.420 (dissimilarity of the two datasets), P-value = 0.00 based on 1000 Monte Carlo iterations.
This analysis is a visualization of a principal coordinates analysis (PCoA) of the Unifrac distances between samples, showing the best superimposition of one Unifrac plot on the other. Samples collected from the same patient before and after treatment are connected by a line, the white end indicating the before-treatment sample red end indicating the after-treatment sample. Patients were classified as improved (red circles), worsened (brown circles) or no change (blue circles). Determination of patient improvement or decline was based on changes in observed pocket depth, a standard approach used in periodontal research [12], [13].

