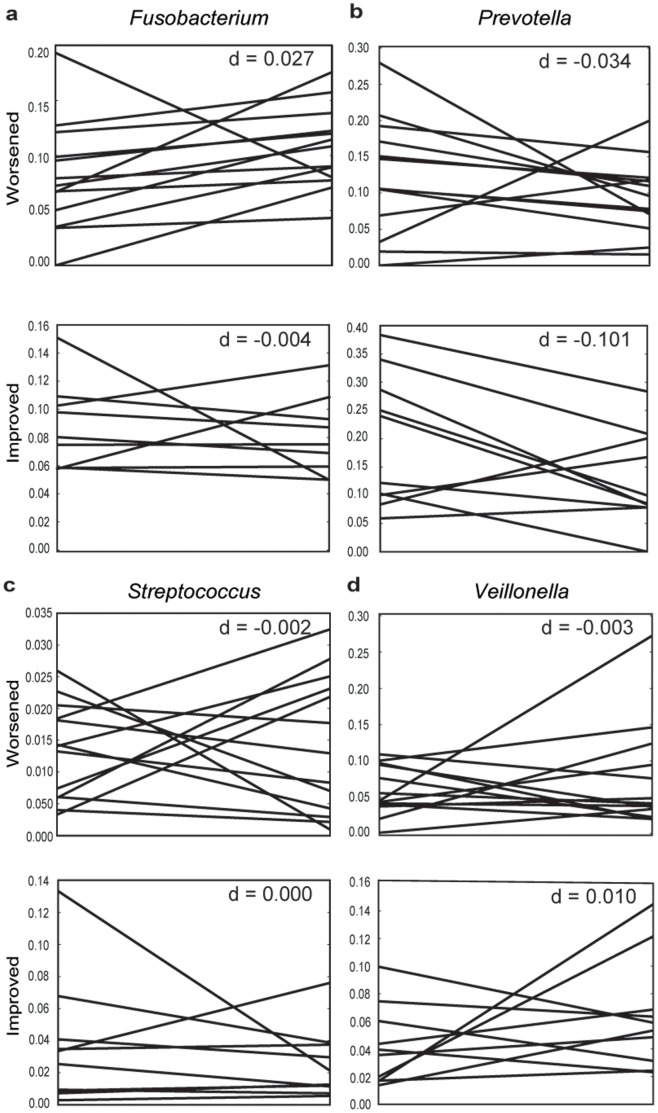
Figure 3. Trends of bacterial genera associated with health or disease, separated by whether individuals improved or worsened after treatment.
An analysis of average periodontal pocket depth before and after treatment showed that less than half (N = 12) the treated individuals improved post-treatment, while the rest stayed the same (N = 6) or worsened (N = 18). Lines indicate the proportion for a particular individual. The d-scores indicate the median line slope. a Fusobacterium, b Prevotella, c Streptococcus, d Veillonella. Note that the scale of the y-axis differs to highlight difference in individual responses to treatment.

