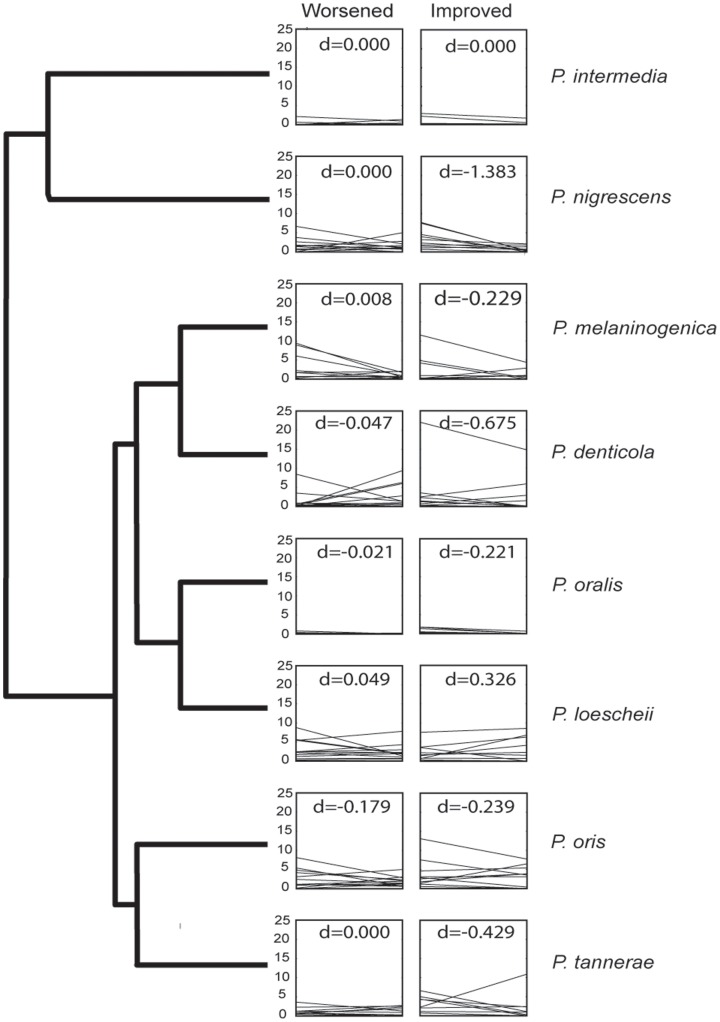
Figure 4. Representative cladogram of Prevotella species determined in this study (based on phylogenetic analysis shown in Figure S2) with plots of relative abundance of specific species divided into patients that improved and patients that worsened.
The d-scores indicate the median line slope. In many cases, changes in relative proportions before and after treatment appeared to be species dependent.

