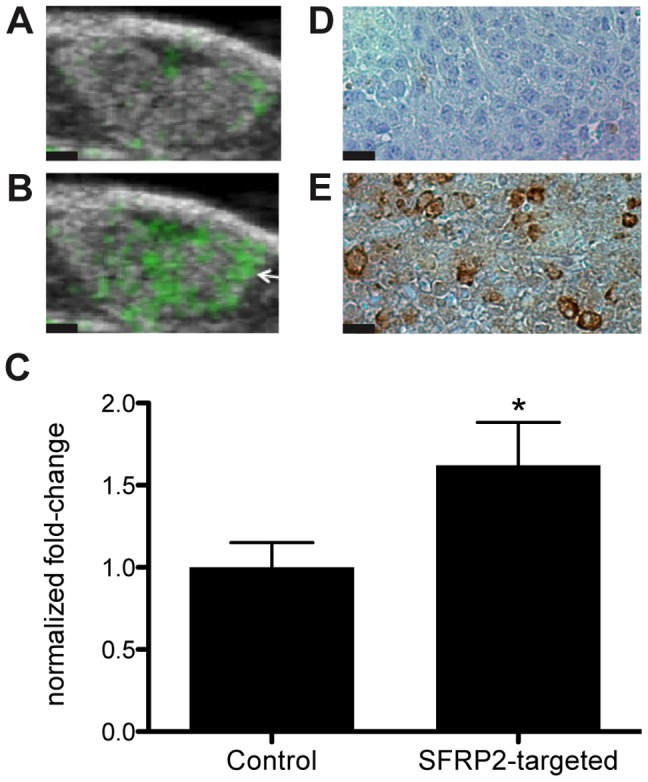
Figure 2. SFRP2 -targeted microbubbles bound specifically to vasculature within angiosarcoma.

B-mode images of the SVR angiosarcoma tumors were overlaid in green with molecular images of (A) control streptavidin loaded microbubbles or (B) SFRP2 -targeted microbubbles after three-dimensional molecular imaging. The average pixel intensity observed for SFRP2 -targeted imaging was significantly higher (*p = 0.003, n = 13, paired t-test, two-tailed) than observed for the streptavidin control (C). Immunohistochemistry demonstrated high levels of expression for SFRP2 in angiosarcoma (D). Black scale bars in panels A and B represent 1 mm. Black scale bars in panels D and E represent 35 µm.
