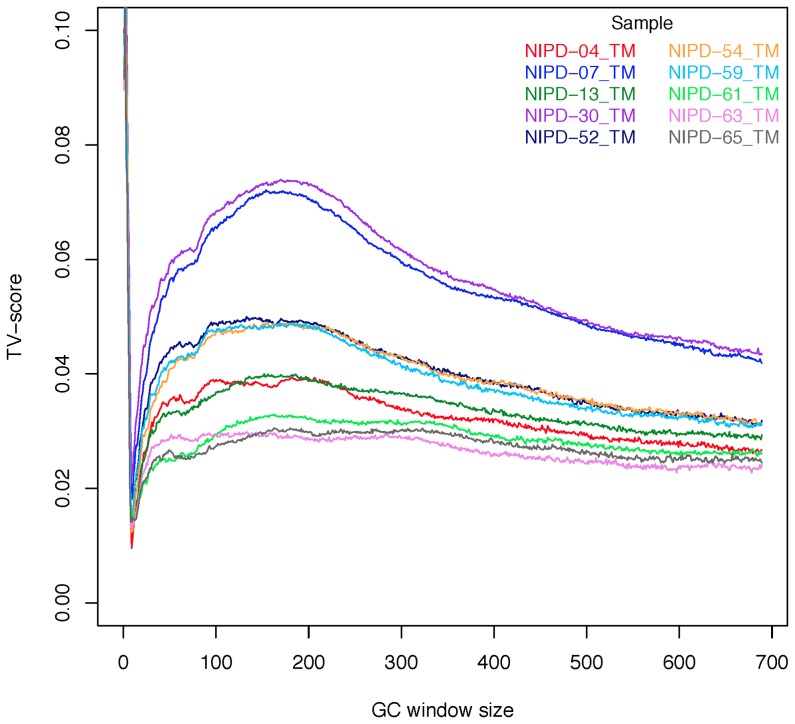
Figure 3. Estimating the optimal window size for GC content.
The truncated plot of the scaled TV scores for 10 representative samples as the GC window size is varied. The TV score indicates the suitability of the window length used to calculate GC content. The peak at windows less than 10–250 bp stems from the wide distribution of fragment lengths in plasma. The TV score is truncated for the fragmentation peak (the range for this peak for the 29 samples is between 0.11 and 0.15).

