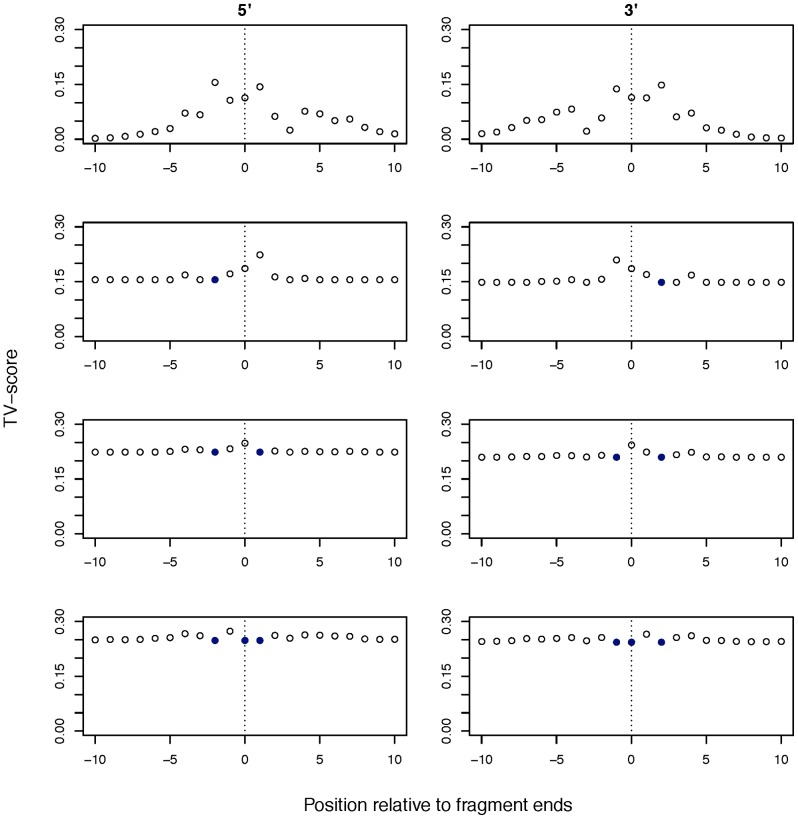
Figure 5. Defining a model for the fragmentation effect.
The TV-score of one representative sample, conditioning on individual positions at breakpoints on the 5′ (right) and 3′ (left) strands sequentially, starting with −2 bp position (2nd row), then adding the 1st bp position (3rd row) and finally the 0th bp position (4th row). After each level of conditioning, the position that shows the highest TV score (in blue) is aggregated into the k-mer used to stratify the reads to set up the next conditioning step and the TV score is recalculated. Bias is no longer visibly location-specific after incorporating the 3-mer at positions −2,0,1. Hence, these positions can be used in a simplified model for the fragmentation bias.

