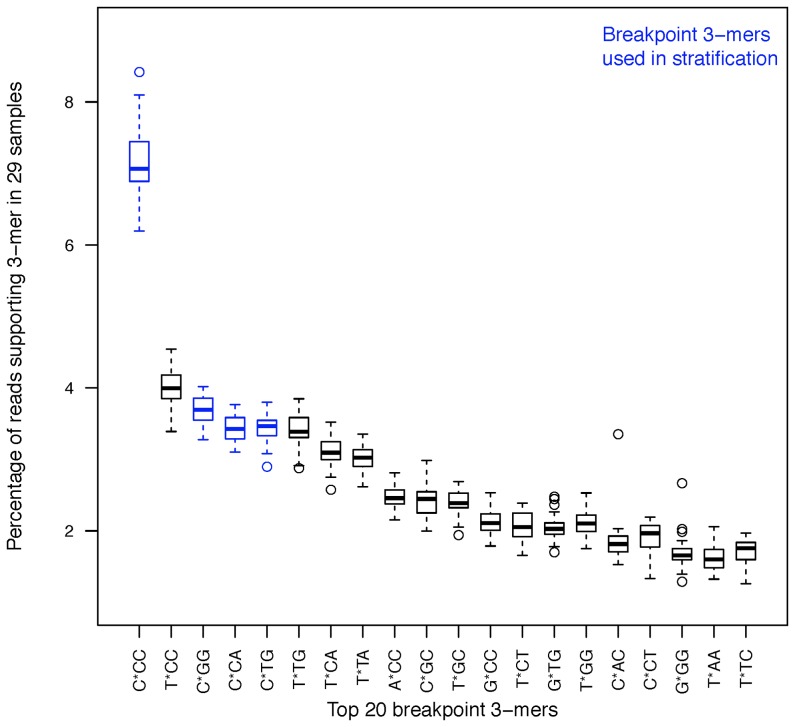
Figure 6. Investigating DNA motifs at the fragment breakpoints.
The percentage of reads for the top twenty 3-mers at the 5′ breakpoint across all samples. Four high frequency motifs (shown in color) were grouped into one class and used in the stratification of reads. This grouping presented the divergent GC profiles shown in Figure 7.

