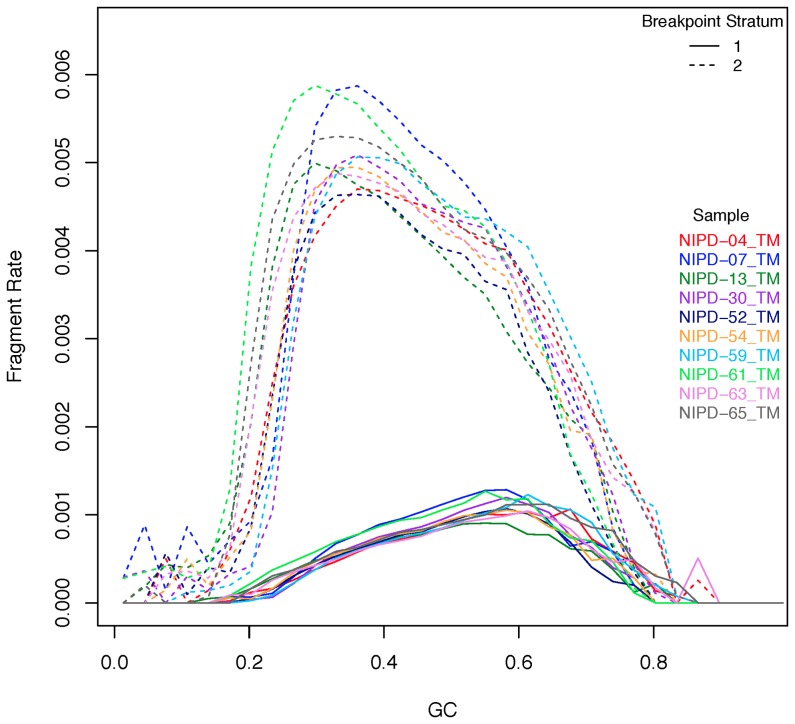
Figure 7. The GC bias profiles of the fragmentation motif classes.
The GC profile of reads belonging to stratum 1 (reads with motifs C*CC, C*GG, C*CA and C*TG inferred from the positions −2, 0, 1 of the mapped reads) and stratum 2 (not any of these 4 motifs). Within each sample, the GC bias show different peak locations for the two sets of DNA fragments, indicating the need for separate corrections.

