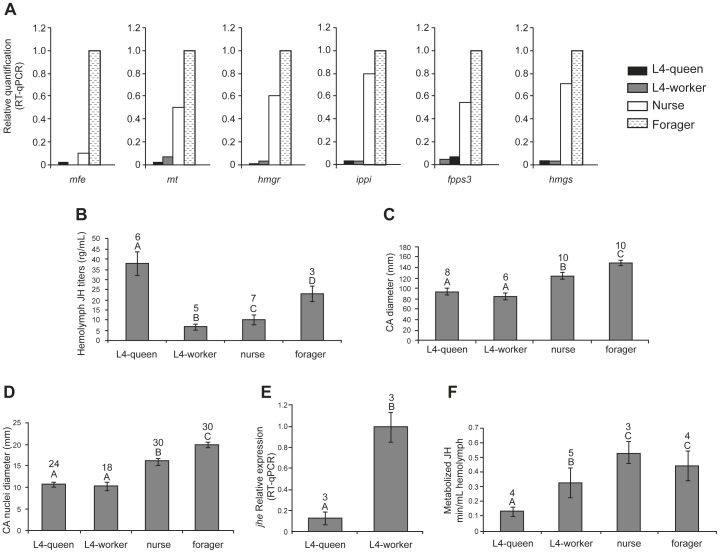
Figure 2. Transcript levels of JH biosynthesis pathway genes, JH titer, corpora allata (CA) size, and JH metabolism in honey bee larvae and adults.
(A) relative expression levels of genes encoding enzymes of the JH biosynthesis pathway in CA-CC complexes; transcript levels were determined by RT-qPCR using a pool of 10 CA-CC pairs; rp49 expression was used for normalization. The highest expression value for each gene was converted to 1. (B) Hemolymph JH titers measured by RIA. (C and D) CA diameter and diameter of CA nuclei measured by confocal microscopy following DAPI staining. (E) relative expression of the jhe gene, the major gene involved in JH metabolism, in the larval whole body. (F) JH metabolism (JHE activity) assayed by partition assay. Data refer to fourth instar (L4) queen and worker larvae, and two stages in the life cycle of adult workers (nurse and forager). Means ± SEM are represented in all panels, with sample sizes (N) shown above bars, except for panel 2A, where transcripts levels were quantified in single pools of CA-CC complexes. Different letters represent statistical differences. Statistical analyses: (2B, C and D) One-way ANOVA, post-hoc Holm-Sidak test, p≤0.001; (2F) One-way ANOVA, post-hoc Tukey test, p≤0.001; (2E) t-test: p≤0.001.

