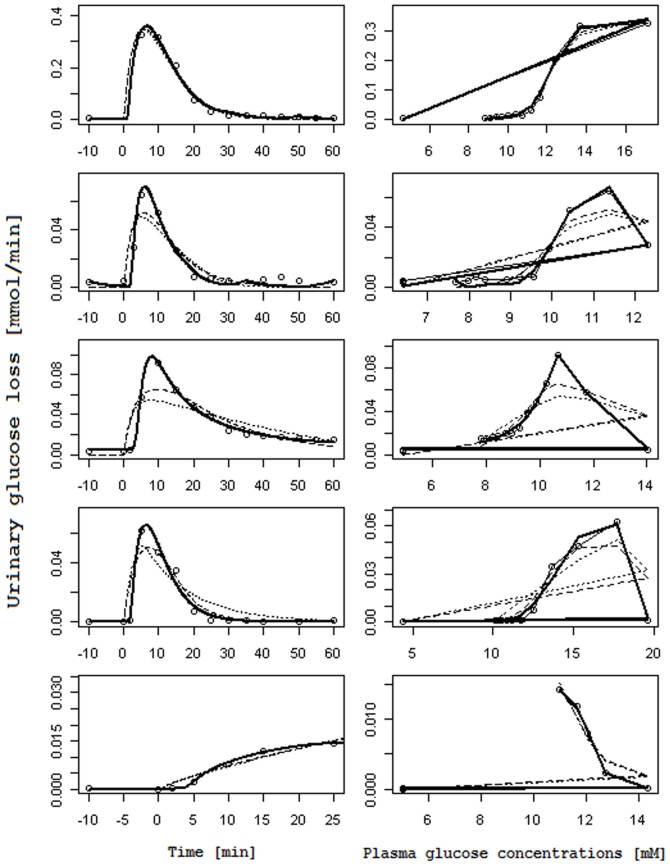
Figure 4. Observed and predicted urinary glucose loss when plasma glucose concentrations are fitted with the two-compartment model.
Columns on the left report the observed Urinary glucose loss [mmol/min] (circles) over Time [min] along with their prediction obtained with the RTH model letting the Slope vary (dashed line), with the RTH model fixing the Slope at 1 (dotted line) and with the PTR model (thick continuous lines). Columns on the right report the same observed Urinary glucose loss (circles), linked with a thin continuous line, in correspondence of the predicted Plasma glucose concentrations [mM] s derived from the two-compartment model for glycemia, along with urinary glucose loss predictions obtained with the RTH model letting the Slope vary (dashed lines), with the RTH model fixing the Slope at 1 (dotted line) and with the PTR Model (thick continuous line).

