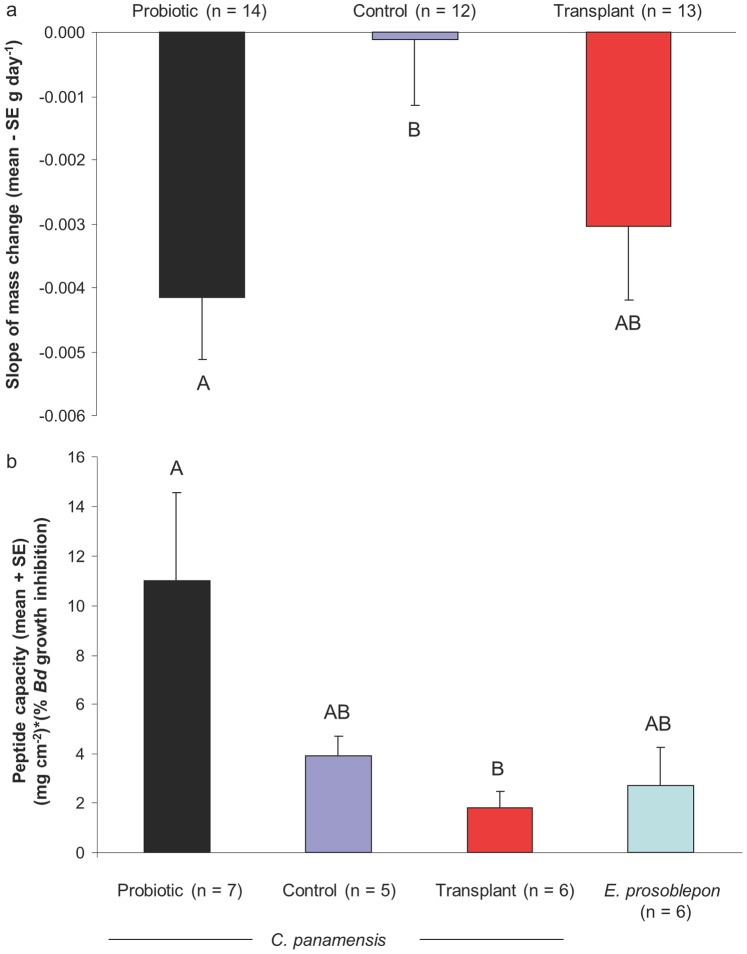
Figure 1. Body mass change and capacity of skin defense peptides against Batrachochytrium dendrobatidis (Bd) of frogs in different treatments.
(a) Slope of mass change. (b) Peptide capacity calculated as peptide quantity per surface area multiplied by percent growth inhibition of Bd caused by 500 µg ml−1 peptide for each treatment or species. Letters above bars indicate homogeneous subsets based on ANOVA with Tukey HSD.

