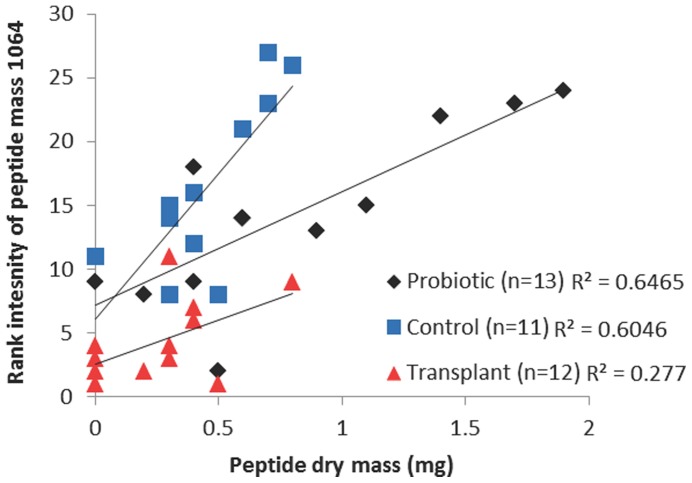
Figure 4. Peptide dry mass predicts a significant proportion of variation in peptide intensity determined by LC-MS.
Overall, there was a significant correlation between peptide dry mass and rank abundance of peptide mass 1064. This relationship differed among treatments indicating a change in the relative abundance of the peptide components of skin secretions depending on microbial treatment. Transplant treated frogs had the highest relative abundance of peptide mass 1064 (lowest rank), and probiotic treated frogs the lowest relative abundance with controls intermediate. Probiotic treated frogs had significantly higher total quantity of peptides than transplant treated frogs (see text).

