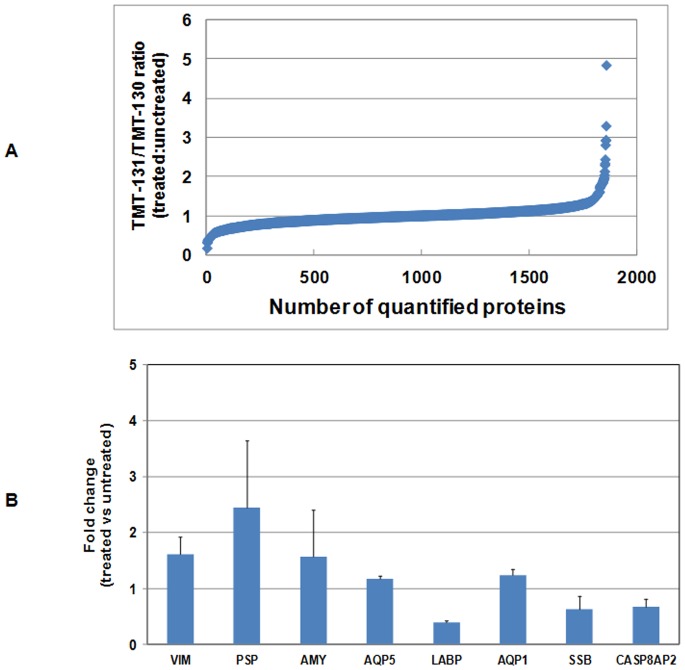
Figure 2. Quantitative proteomic analysis of SMG tissue proteins in untreated and BM SOUP treated NOD mice (n = 4 per group) using tandem mass tagging and 2-D LC-MS/MS.
(A) Ratios of 131 to 130 represent the relative levels of proteins between BM SOUP-treated (TMT-131) and untreated (TMT-130) NOD mice. In total, 1885 proteins were identified with at least two matched, TMT-labeled peptides. (B) The relative expression levels of vimentin (VIM), parotid secretory component protein (PSP), alpha-amylase (AMY), aquaporin 5 (AQP5), lacrimal androgen-binding protein (LABP), Sjogren’s syndrome antigen B (SSB), aquaporin 1 (AQP1) and caspase 8 associated protein 2 (CASP8AP2) between untreated and BM Soup-treated mice.

