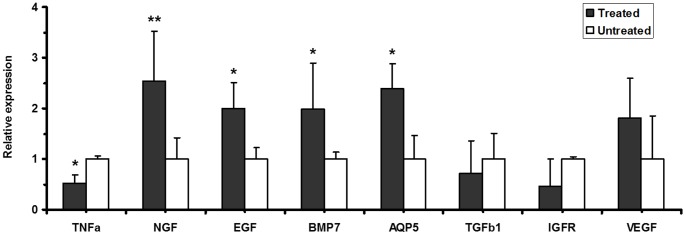
Figure 4. Relative gene expression of TNFa, TGFb1, IGFR, EGF, NGF, VEGF, BMP7 and AQP5 in the SMGs of the BM SOUP-treated NOD mice (n = 4) versus the untreated NOD mice (n = 4).

The mRNA levels of TNFa, EGF, NGF, BMP7 and AQP5 were significantly altered in the treated NOD group (*p<0.05; **p<0.01).
