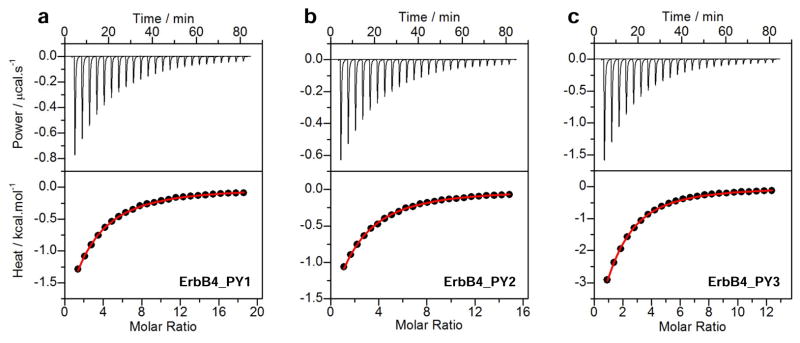
Figure 4.

ITC analysis for the binding of WW1–WW2 tandem module of WWOX to ErbB4_PY1 (a), ErbB4_PY2 (b) and ErbB4_PY3 (c) peptides. The upper panels show the raw ITC data expressed as change in thermal power with respect to time over the period of titration. In the lower panels, change in molar heat is expressed as a function of molar ratio of corresponding peptide to WW1–WW2 tandem module. The red solid lines in the lower panels show the fit of data to a one-site binding model using the integrated ORIGIN software as described earlier (43, 46).
