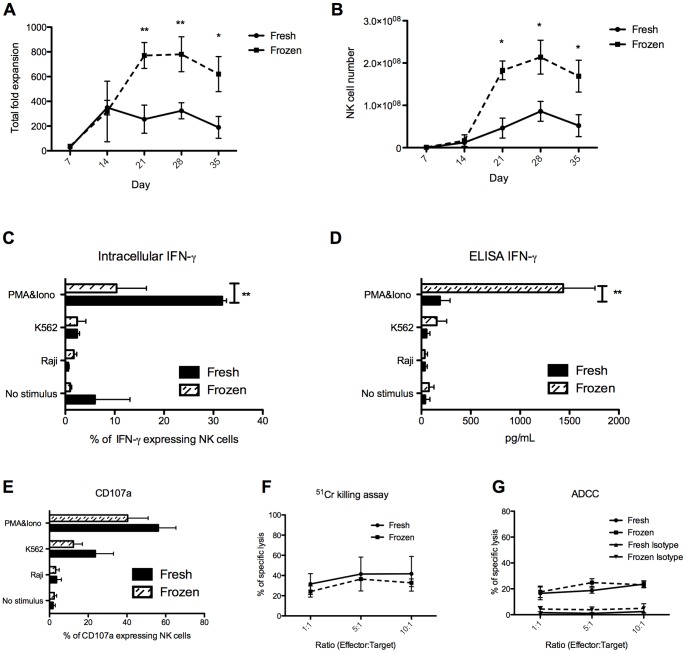
Figure 1. NK cell production from fresh and frozen CBCD34+.
(A) Total fold expansion and (B) CD3−CD56+ NK cell number of fresh (n = 3) and frozen (n = 4) CBCD34+ cultures at different time points. (C) Intracellular expression of IFN-γ and (D) secreted IFN-γ as measured by ELISA for NK cells from fresh (n = 3) and frozen (n = 4) CBCD34+ cultures. (E) Degranulation assay using CD107a on CD56+CD3− cells from fresh (n = 3) and frozen (n = 4) CBCD34+ cultures. NK cells from fresh (n = 3, solid line) and frozen (n = 4, dotted line) CBCD34+ cultures were co-incubated with 51Cr-labeled K562 cells (F) or 51Cr-labeled P815 cells (G) coated with anti-CD16 or an isotype control at different effector-target ratios in a standard 4 h 51Cr-release assay. The statistical analysis was performed using Mann-Whitney test, * P<0.05, ** P<0.005.

