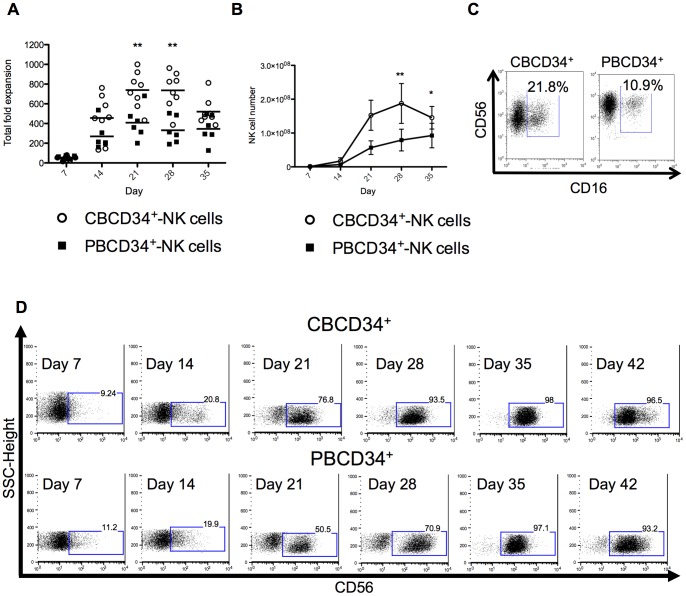
Figure 2. NK cell production from CBCD34+ and PBCD34+.
(A) Total fold expansion and (B) CD3−CD56+ NK cell number of CBCD34+ (n = 8) and PBCD34+ (n = 6) cultures at different time points. (C) Representative plot of CD56 vs CD16 from the lymphocyte gate for CBCD34+ and PBCD34+ cultures. (D) Representative side scatter vs CD56+ plots for CBCD34+ (upper row) and PBCD34+ (bottom row) cultures at days 7, 14, 21, 28, 35 and 42. Mann-Whitney test was performed, * P<0.05, ** P<0.005.

