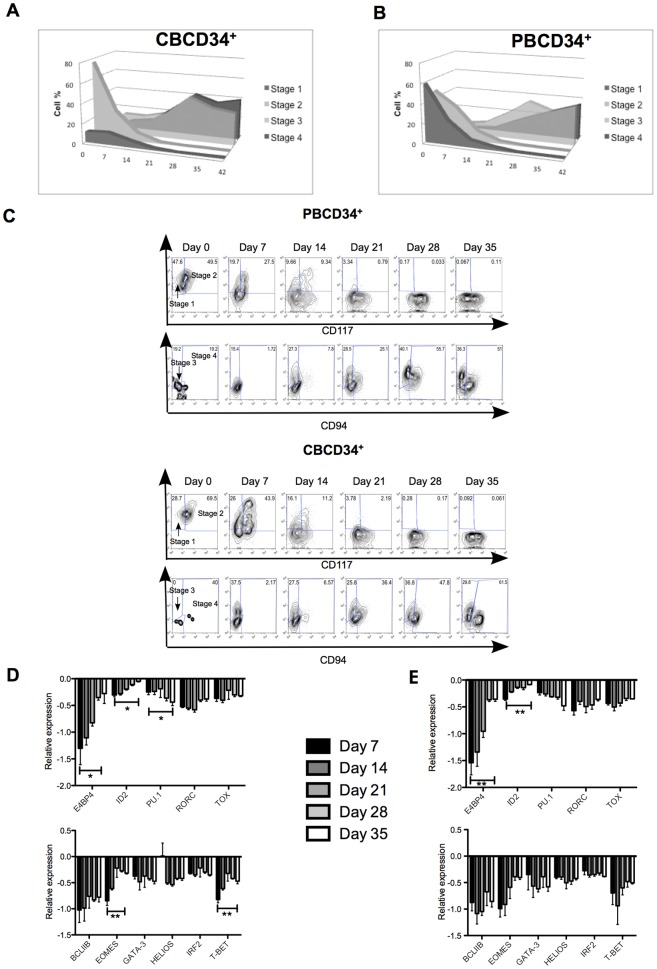
Figure 3. NK cell development in CBCD34+ and PBCD34+ cultures.
NK cell stages 1–4 for one representative sample from CBCD34+ (n = 8) (A) and PBCD34+ (n = 6) (B) cultures. Percentages are gated from CD3− cells according to the following NK cell stages: stage 1: CD34+CD117−CD94−, stage 2: CD34+CD117+CD94−, stage 3: CD34−CD117+CD94− and stage 4: CD34−CD117+/−CD94+. (C) NK cell stages are shown for one representative sample for CBCD34+ (n = 8, upper panel) and PBCD34+ (n = 6, bottom panel) cultures at different time points. Stage 1 and 2 are from the CD3−CD94− gate and stages 3 and 4 from the CD3−CD34− gate. Transcriptional analysis for each time point is shown for transcription factors involved in NK cell differentiation (left panel) and maturation (right panel) for CBCD34+ (n = 4) (D) and PBCD34+ (n = 3) (E) cultures. Values are normalized using three reference genes. Higher ratio values correspond to less mRNA expression.

