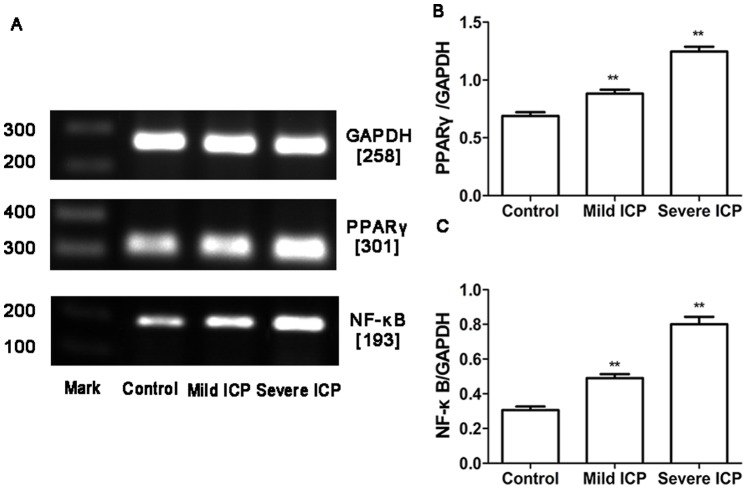
Figure 2. Expression of PPARγ and NF-κB mRNA in placentas from control group and ICP groups.
(A) RT-PCR analysis of placental PPARγ and NF-κB mRNAexpression in control, mild ICP and sever ICP groups. (B) Graphical summary of data on the expression of PPARγ mRNA. (C) Graphical summary of data on the expression of NF-κB mRNA. The data are expressed as the mean ± S.D., **p<0.01 vs. control group.

