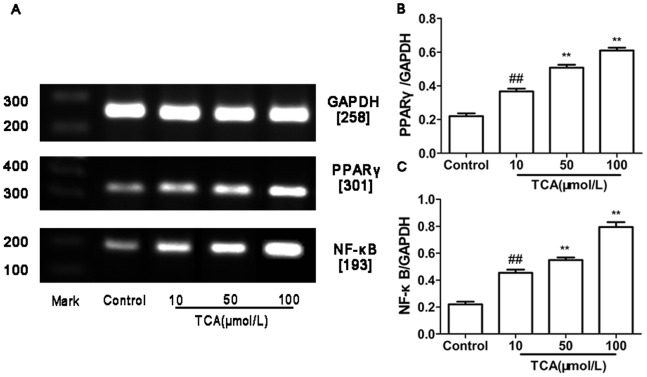
Figure 4. Expression of PPARγ andNF-κB mRNA in cultured HTR-8/SVneo cell.
(A) RT-PCR analysis of placental PPARγ and NF-κB mRNA expression in control, mild ICP and sever ICP group. (B) Graphical summary of data on the expression of PPARγ mRNA. (C) Graphical summary of data on the expression of NF-κB mRNA. The data are expressed as the mean ± S.D., ## p<0.01vs. control group, **p<0.01 vs. TCA 10 µM/L group.

