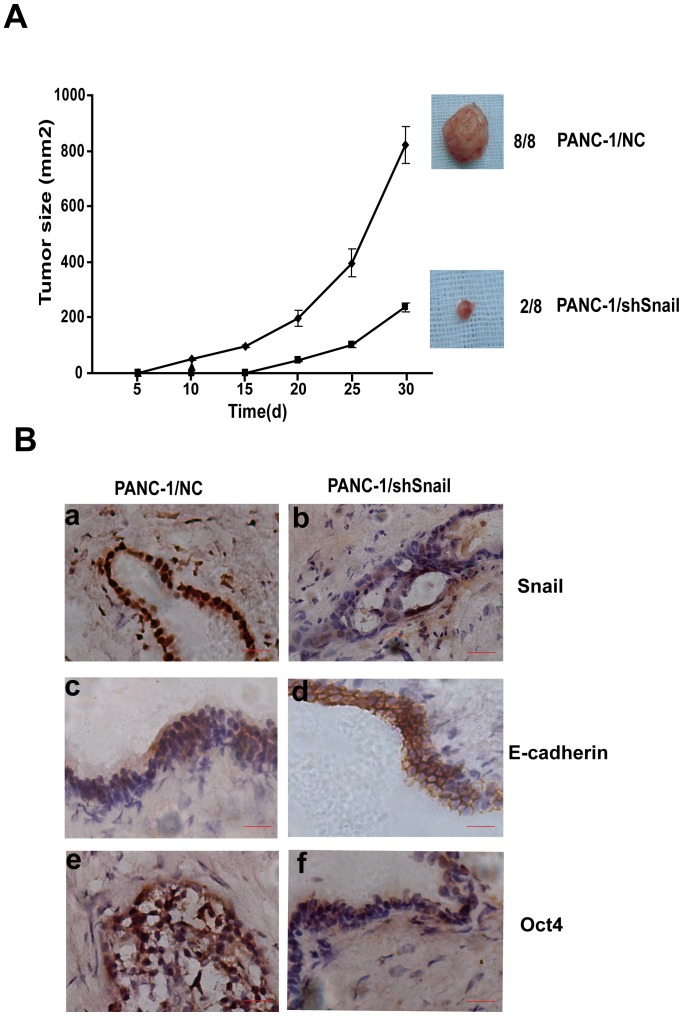
Figure 5. Validation of the role of Snail in tumorigenicity in mouse.
A. Graphical representation of growth rates of subcutaneous xenograft tumors using cells of Panc-1/NC and Panc-1/shSnail. 2×10⁵ of each cell was transplanted in eight mice per group. All mice in the Panc-1/NC group, while only 2 mice in the Panc-1/shSnail group had tumor formation. B. Expression of Snail, E-cadherin, and Oct4 in xenograft tumors. Representative examples of Snail, E-cadherin, and Oct4 expression determined by immunohistochemistry. Strongly positive Snail expression is present in the nucleus and cytoplasm of Panc-1/NC tumors (a) but not in Panc-1/shSnail tumors (b). Expression of E-cadherin is weak and heterogeneous in the Panc-1/NC tumors (c), but more intensive in the membrane of Panc-1/shSnail tumors (d). Lower level of Oct4 expression is present in the Panc-1/shSnail tumors (f), as compared to that of Panc-1/NC tumors (e). Scale bars: 10 µm.

