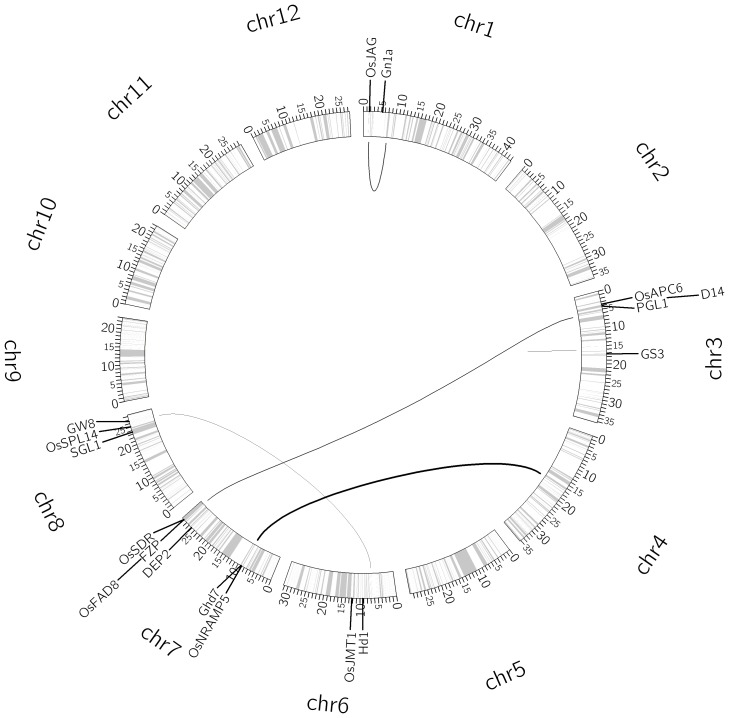
Figure 2. Interaction network of nine QTLs for the number of grains per panicle.
The circle shows the bin map and columns indicate position of the makers (ticks in million base pairs). The thickness of a link is proportional to the strength of the interaction effect. A short straight line indicates a main effect. Molecularly characterized genes related to yield are also labeled in the appropriate positions of the genome.

