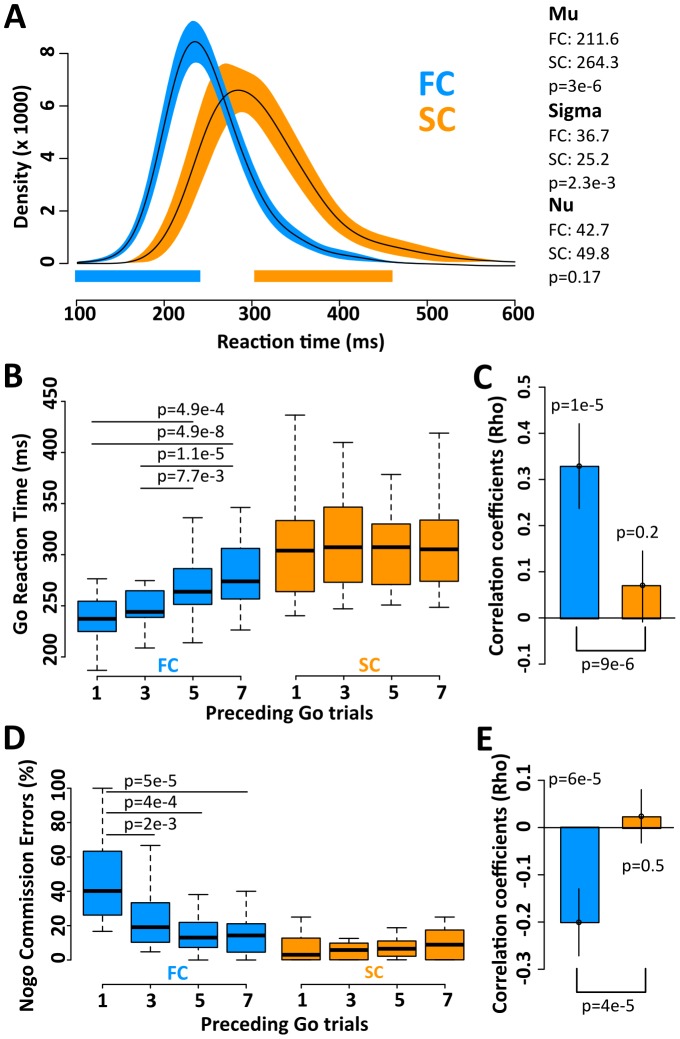
Figure 2. Behavioral results.
A. Density distribution for reaction times to Go trials in FC (blue), and SC (orange). The bar below represents regions where the distributions are significantly different (blue, FC > SC; orange, SC >FC; p<0.05, Bonferroni corrected). B. Go trial reaction times classified by the number of consecutive Go trials that preceded a Nogo trial (1,3,5 and 7) for FC (blue) and SC (orange). C. Correlation coefficients (Rho) between Go trials that preceded a Nogo trial and the respective Go trial reaction time, calculated per each subject and condition. D. Nogo trial errors classified by the number of consecutive Go trials that preceded a Nogo trial (1,3,5 and 7) for FC (blue) and SC (orange). E. Correlation coefficients (Rho) between Nogo trial errors and number of Go trials that preceded a Nogo trial, calculated per each subject and condition. B, D. Boxes represent the interquartile range and the whiskers the most extreme data points. C, E. Error bar represent the 95% confidence interval by bootstrapping distributions.

