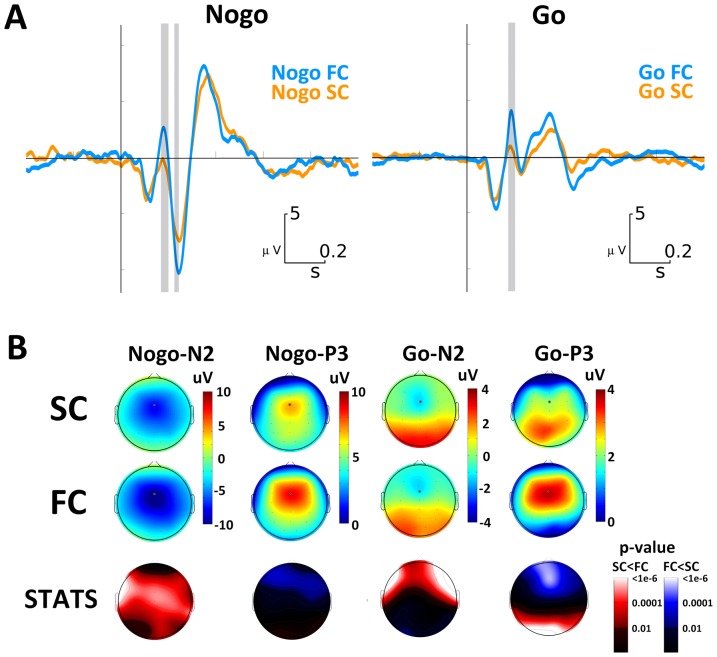
Figure 3. ERP results for all Go and Nogo trials.
A. ERP for Nogo and Go trials in FC (blue line) and SC (orange line), measured at FCz electrode. B. Topographic distributions of Nogo-N2, Nogo-P3, Go-N2 and Go-P3 for FC (first raw) and SC (second raw). Statistical differences between FC and SC topographies are depicted in the third row.

